




Samsung Electronics received the most US utility patents in 2025: 7,526 of the 325,014 granted, according to the IPO list of the 300 organizations granted the most US patents. The organizations on that list received about 168,000 patents, roughly 52 percent of all grants. Patent concentration, as used here, means the share of patents granted in a year to the largest owners.
Share of grants taken by the top 300
IPO, the Intellectual Property Owners Association, published its list on June 15, 2026, for the 43rd consecutive year, and its end notes say it has issued the report annually since 1984. Harrity Analytics compiled the list from data supplied by the USPTO. It reports 325,014 utility patents granted in calendar 2025, which IPO describes as up 0 percent from 2024. Under 35 U.S.C. 101, utility patents cover a new and useful process, machine, manufacture or composition of matter, and IPO counts that category only.
Summing the 2025 counts for the 303 organizations printed on IPO’s list gives 168,031 patents, or 51.7 percent of 325,014. Ties push the number of printed names above 300. This is arithmetic on IPO’s table, and IPO doesn’t publish the figure itself. IPO’s end notes state that a patent granted jointly to two or more organizations is credited to each of them, so the sum can count some patents twice, and 51.7 percent is the upper end of the share of distinct patents.
Harrity published two sets of figures. Its announcement of January 26, 2026 described the list as more than 54 percent of more than 330,000 patents issued in 2025, which implies at least 178,000 patents for the list. Its June 2026 report has industry tables that add up to 167,594 patents, 437 fewer than the IPO sum and 51.6 percent of IPO’s total of 325,014. The two Harrity documents imply different totals, and both place the top 300 above one half.
The same arithmetic for 2024 gives a similar result. IPO’s 2024 list counts 324,042 utility patents for that year, and the figures printed on it add up to roughly 168,700, about 52 percent.
The ten largest owners
IPO prints each count with its change from 2024.
| Rank | Organization | Patents granted in 2025 | Change from 2024 |
|---|---|---|---|
| 1 | Samsung Electronics | 7,526 | +12% |
| 2 | TSMC | 4,233 | +6% |
| 3 | Qualcomm | 3,925 | +10% |
| 4 | Huawei Technologies | 3,482 | +6% |
| 5 | Canon | 2,988 | +13% |
| 6 | Samsung Display | 2,925 | +12% |
| 7 | Toyota Jidosha | 2,908 | +19% |
| 8 | Apple | 2,854 | -8% |
| 9 | IBM | 2,467 | -11% |
| 10 | Dell Technologies | 2,445 | +38% |
Together, these ten organizations hold 35,753 patents by arithmetic on IPO’s table, 11.0 percent of all utility patents granted in 2025. Samsung Electronics alone holds 2.3 percent. TSMC, second on the list, holds 1.3 percent, and every organization below it holds less. Concentration here comes from several hundred large owners, each with a small slice of the total.
Harrity’s January announcement listed slightly different counts for the same organizations, 7,519 for Samsung Electronics and 4,232 for TSMC, while its June report matches IPO at 7,526 and 4,233. IPO notes that corporate transactions and inconsistent treatment of subsidiaries can change an organization’s count, and its end notes record that the Samsung and LG groups were split into separate entities for the 2025 list. Samsung Electronics and Samsung Display appear separately, as do LG Electronics and LG Energy Solution. A ranking of corporate groups depends on where the counting boundary is drawn.
Entry thresholds along the ranking
IPO’s 2025 table shows how steeply the count falls down the list.
| Rank | Organization | Patents granted in 2025 |
|---|---|---|
| 1 | Samsung Electronics | 7,526 |
| 10 | Dell Technologies | 2,445 |
| 50 | Applied Materials | 810 |
| 100 | Caterpillar | 456 |
| 200 | AAC Technologies Holdings, tied with Mass General Brigham | 220 |
| 300 | Shared by several organizations | 146 |
By IPO’s counts for 2025, the top 10 owners hold 35,753 patents (11.0 percent of all grants), the top 50 hold 88,292 (27.2 percent), the top 100 hold 118,479 (36.5 percent) and the top 300 hold 168,031 (51.7 percent).
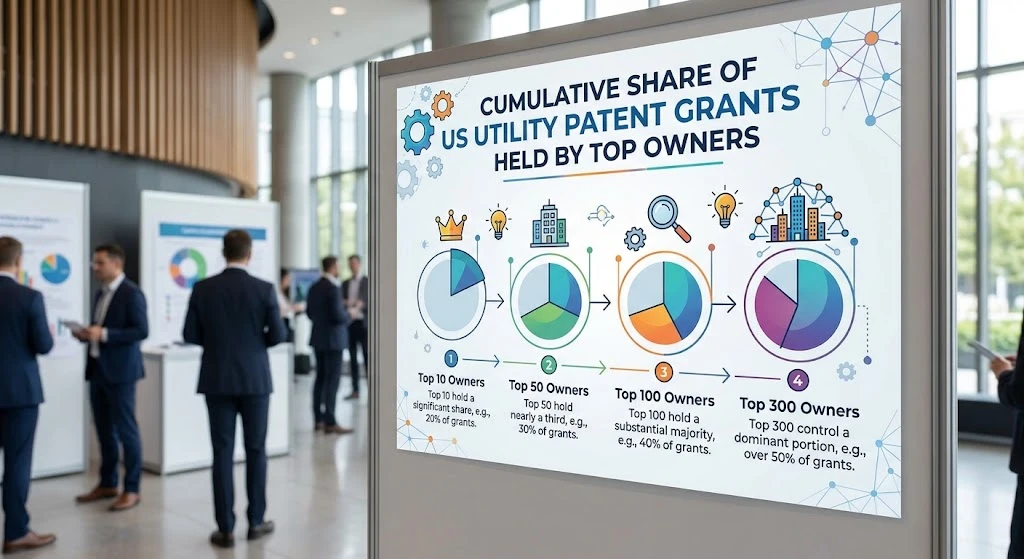

Cumulative shares of 2025 grants at each rank cutoff, calculated from the counts in the IPO list.
In IPO’s 2025 table, owners in ranks 11 to 100 account for 82,726 patents, 25.5 percent. The 203 organizations in ranks 101 to 300 hold 49,552 together, 15.2 percent of all grants and about 1.4 times the combined count of the ten largest owners. A count of 146, the cutoff, equals 0.04 percent of that year’s grants.
Year-to-year movement in the list
IPO lists 22 organizations as new to the 2025 list, among them Palo Alto Networks (#273), Truist Bank (#278), Northwestern University (#289) and Amgen (#293). Among organizations on both lists, Corteva is the largest percentage mover IPO names, up 180 percent to 548 patents (#83). Intel rose 9 percent to 2,137 patents (#15), while Alphabet fell 13 percent to 2,249 (#12) and Amazon fell 6 percent to 1,591 (#20).
Total grants were nearly flat: 325,014 against 324,042 in 2024, a rise of 0.3 percent by simple arithmetic that IPO rounds to zero. By the same arithmetic the top 300 took about 52 percent in both years.
Boundaries of the count
IPO counts utility patents granted in calendar 2025 that name the organization or one of its subsidiaries as owner on the printed patent, with subsidiaries combined into the parent. Other USPTO sources mark further limits.
- Utility patents only. USPTO’s FY 2025 Workload Tables record 327,665 utility patents issued in fiscal year 2025, alongside 51,825 design patents and 824 plant patents. With 459 reissues the total is 380,773 patents of all types.
- Grants only. Under 35 U.S.C. 122(b), applications are in general published promptly after 18 months from the earliest filing date, subject to exceptions in the statute. Recent filings do not appear in a count of grants, and USPTO reports an average total pendency of 26.3 months for FY 2025.
- Grants, not patents in force. A patent term generally ends 20 years from the filing date of the application (35 U.S.C. 154(a)(2)). Maintenance fees fall due at 3.5, 7.5 and 11.5 years after grant under 35 U.S.C. 41(b), except for design and plant patents, and a patent expires if a fee stays unpaid past the six-month grace period. A count of grants says nothing about how many patents remain in force.
- Calendar year versus fiscal year. IPO counts calendar 2025 and arrives at 325,014. USPTO’s workload tables follow the fiscal year from October 1, 2024 to September 30, 2025; they show 327,665.
- Owner at grant. Under 35 U.S.C. 261, patents have the attributes of personal property and can be assigned by an instrument in writing, and USPTO keeps a register of interests. A ranking built on owners at grant shows who held the patents when they issued, which can differ from who holds them today.
- Joint grants and corporate trees. A jointly granted patent is credited to each organization, subsidiaries roll up into the parent, and the 2025 list restructured the Samsung and LG groups.
- Count is not value. IPO cautions that a larger count does not by itself show better technology, more effective research or higher profit, and that counts differ widely by industry.
Who gets the other half
Subtracting the top-300 sum from IPO’s 2025 total leaves 156,983 patents, 48.3 percent, granted to organizations below the cutoff and to individuals. The figure is a lower bound, because jointly credited patents inflate the top-300 sum.
USPTO sorts applicants by fee status into large entities and, at reduced fees, small and micro entities. Its FY 2025 Workload Tables report the shares of utility patents issued: 75.79% to large entities, 22.03% to small entities and 2.17% to micro entities. Where the first-named inventor lives in the United States, the shares are 68.83%, 27.81% and 3.37%. Small entities cover persons and small businesses as well as nonprofit organizations that meet the conditions in 37 CFR 1.27. Micro entity status adds a gross income limit, $262,380 as of September 15, 2026; an institution of higher education basis is the alternative.
USPTO’s FY 2025 large-entity share of 75.79 percent exceeds the top-300 share of 51.7 percent from IPO’s 2025 list, yet the two cannot be subtracted from each other, because their periods and categories differ.
Public-sector and academic owners sit on the list as well. The US Federal Government appears with 872 patents in 2025 (#47, down 8 percent). Nine US universities are on it: University of California with 580 (#79), MIT with 286 (#161), University of Texas System with 240 (#185), Stanford with 202 (#217), Arizona State with 183 (#242), Michigan with 174 (#252), Purdue with 171 (#262), Harvard with 156 (#280) and Northwestern with 151 (#289). Harrity’s industry table puts 5,185 patents in Education / Research in 2025, 3.1 percent of its total.
The IPO list names no owners below the cutoff, so these data cannot say how many distinct owners share the remaining patents.
USPTO fees behind a large portfolio
USPTO’s fee schedule, effective since January 19, 2025 (last revised August 14, 2026), lists fees for one utility application filed electronically through Patent Center. It gives a standard level and two reduced levels for small and micro entities. The table sums USPTO’s fees for one utility patent held to year 11.5.
| USPTO fee | Standard | Small entity | Micro entity |
|---|---|---|---|
| Filing, search and examination | $2,000 | $730 | $400 |
| Issue fee | $1,290 | $516 | $258 |
| Maintenance at 3.5 years | $2,150 | $860 | $430 |
| Maintenance at 7.5 years | $4,040 | $1,616 | $808 |
| Maintenance at 11.5 years | $8,280 | $3,312 | $1,656 |
| Total through year 11.5 | $17,760 | $7,034 | $3,552 |
In USPTO’s 2026 schedule the standard $2,000 is a $350 filing fee plus search and examination fees of $770 and $880. Small entities pay a $70 basic filing fee when they file electronically, which with search and examination fees of $308 and $352 gives $730, and micro entities pay $70 plus $154 and $176 for $400. Maintenance payments alone total $14,470 at the standard level, $5,788 for small entities and $2,894 for micro entities. Attorney fees and other charges come on top.
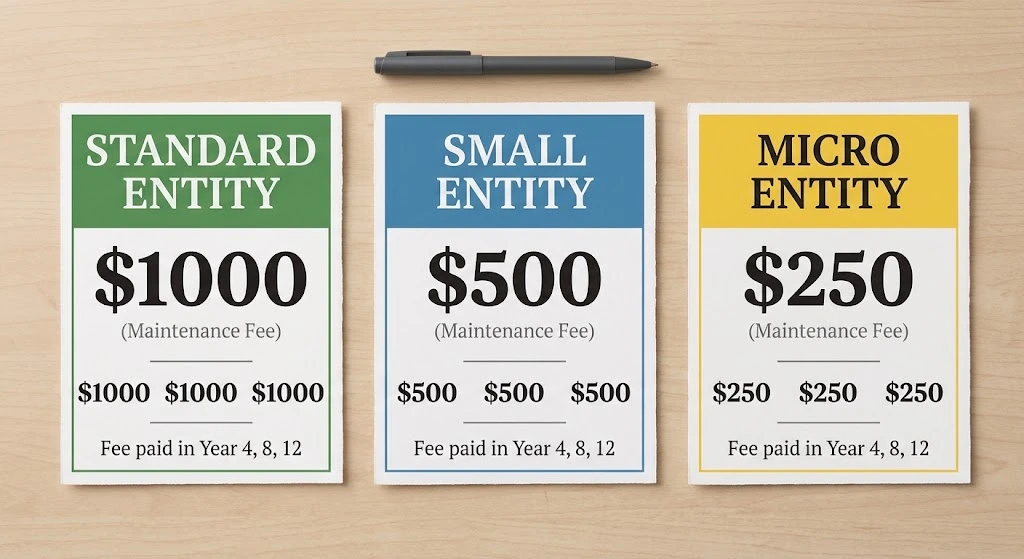

USPTO fee schedule revised August 14, 2026, with totals added from its line items and excluding attorney fees.
At the standard level, USPTO’s 2026 fees from filing to issue come to $3,290 for one utility patent. Actual amounts depend on entity status, application type and the schedule in force when the application was filed.
USPTO’s FY 2025 Workload Tables give an average first action pendency of 22.6 months and a total average pendency of 26.3 months for utility applications together with plant and reissue ones. By technology center, first action averages range from 19.1 to 28.5 months and total pendency from 26.3 to 33.8 months.
Concentration by industry
Harrity’s report groups organizations into 21 industries and totals their 2025 patents. Consumer Electronics is the largest group at 32,599 patents, followed by Semiconductors at 27,120 and Computer Hardware, Software & IT Services at 21,120. Diversified Technology & Industrial Solutions holds 20,452, Automotive 14,408 (up 11 percent) and Healthcare 10,184, against 10,185 in 2024.
Harrity’s first three groups account for 80,839 of the 167,594 patents in its 2025 tables, 48.2 percent, and the first five for 115,699, or 69.0 percent. Smaller groups include Education / Research at 5,185 patents (up 7 percent), Finance at 4,410 (down 17 percent) and NPE / Licensing / R&D at 1,237, 0.7 percent of the total. Classification is Harrity’s own.
Measuring concentration in one technology area
The same method can be applied to a single technology area, once its assumptions are stated:
- Fix the field and the period, using grant dates so the result matches what the IPO and Harrity lists measure.
- Collect granted patents and their owners at grant from USPTO Patent Public Search or from USPTO’s open patent data. Patent Public Search requires a USPTO account beginning November 7, 2026. USPTO announced in March 2026 that PatentsView, its open patent data resource, would migrate to the Open Data Portal on March 20, with some functions pausing temporarily.
- Merge spelling variants of owner names and roll majority-owned subsidiaries into their parents, as IPO does in its own list.
- Rank owners by count and compute cumulative shares for the top 10 and the top 100.
- Record the date of the data pull and keep in mind that filings from roughly the most recent 18 months are not yet public under 35 U.S.C. 122(b).
This article reports published data and statutes and gives no legal advice. Questions about a particular patent or filing belong with a registered patent attorney or agent.
What a ranking cannot tell a company about its own idea
A national ranking describes who gets patents across the whole system. It doesn’t show whether the space around one product or invention is crowded, whether a close existing patent exists or where open ground lies. Those are questions at the level of individual patents and published applications.
Precursal works at that stage. Its home page describes an AI platform for ideas and patents that helps inventors and R&D teams explore ideas, uncover white space, research prior art, document human conception and prepare stronger materials for patent counsel. A guided assistant, Professor Eddi, helps users explore an idea and move it forward, and the platform covers hardware and software as well as physical products and scientific inventions.
Each idea is read across five dimensions: novelty, overlap, differentiation, contribution and competition. The home page describes competition as how crowded the surrounding patent landscape is, and it names three audiences: inventors and founders, engineers and R&D teams, and patent and legal teams. Precursal states that it is not a law firm and that it surfaces prior-art signals and research insights without determining or guaranteeing novelty, patentability, validity or enforceability.
Frequently asked questions
Who owns the most patents in the United States?
Samsung Electronics received the most US utility patents in 2025, 7,526 according to IPO’s list based on USPTO data, and Harrity’s June report gives the same count. TSMC follows with 4,233 and Qualcomm with 3,925. These figures count patents granted in the calendar year, not the total each organization owns.
How many utility patents does the USPTO grant in a year?
IPO reports 325,014 utility patents granted in calendar 2025. USPTO’s FY 2025 Workload Tables, which follow the fiscal year ending September 30, 2025, record 327,665 utility patents issued, against 326,189 in FY 2024 and a high of 360,784 in FY 2020. Design patents (51,825 in FY 2025) and plant patents (824) are counted separately.
What share of US patents do the largest owners hold?
By arithmetic on IPO’s 2025 table, the ten largest owners hold 11.0 percent of utility patents granted, the top 100 hold 36.5 percent and the top 300 hold about 51.7 percent. Because jointly granted patents are credited to each organization, the share of distinct patents is slightly lower.
Can a small company or an individual own a patent?
Yes. USPTO’s FY 2025 Workload Tables show 22.03 percent of utility patents issued to small entities and 2.17 percent to micro entities, and USPTO states that small entities get a 60% discount on most patent fees and micro entities 80%. Patents and applications can also be assigned by a written instrument under 35 U.S.C. 261, so the owner at any time can differ from the original applicant.
Who publishes the top 300 list, and since when?
IPO publishes the list, and Harrity Analytics compiles it from USPTO data. IPO’s end notes say it has issued the report annually since 1984, and the 2025 list, released June 15, 2026, is the 43rd. It counts utility patents by owner and combines subsidiaries with their parents.
Does a larger patent count mean better technology?
IPO’s end notes caution that the number of patents granted does not necessarily show the value of a company’s technology, how effective its research is or whether it will be profitable. Counts also differ widely between industries: Harrity’s 2025 tables show 32,599 patents for Consumer Electronics and 10,184 for Healthcare.
Where can I look up the patents a company owns?
USPTO Patent Public Search is the USPTO’s search application, and it requires a USPTO account beginning November 7, 2026. USPTO announced in March 2026 that PatentsView, its open patent data resource, would migrate to the Open Data Portal on March 20. Owner names appear as printed, so a search should allow for spelling variants and subsidiaries.